How to create PowerPoint Infographics: A Step-by-Step Guide
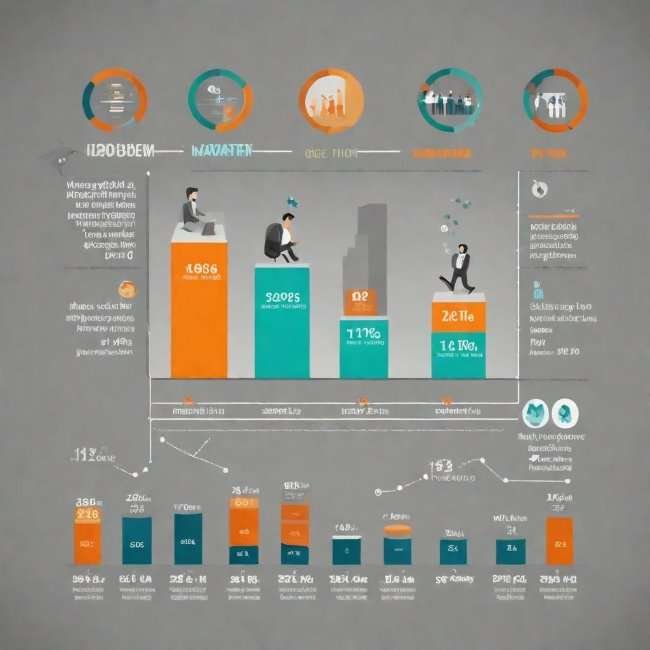
In the digital age, where information overload is a constant challenge, infographics have emerged as powerful tools to convey complex ideas in a visually engaging manner. We’ll delve into the process of making infographics, including how to create, information presentation, timeline infographics and infographic posters.
In this article, we will explore the realm of infographics, with a specific focus on creating them using the ubiquitous Microsoft PowerPoint.
An infographic is a graphic representation of information, data, or knowledge intended to present information quickly and clearly.
Table of Contents
Understanding Infographics
An infographic is a blend of information and graphics, combining text, images, and design elements to communicate a message efficiently. It serves as a visual aid to simplify complex concepts, making it easier for the audience to comprehend information. Infographics are widely used in presentations, reports, social media, and educational materials due to their ability to captivate attention and enhance understanding.
How to Create Infographics in PowerPoint
PowerPoint, a software traditionally associated with presentations, can be a surprisingly versatile tool for crafting infographics. Here’s a step-by-step guide on how to create an infographic in PowerPoint:
- Define Your Message: Before diving into PowerPoint, clearly define the key message you want to convey. Identify the main points and data you wish to include in your infographic.
- Select a Template: PowerPoint offers various templates that can serve as a starting point for your infographic. Choose one that aligns with the theme and purpose of your graphic.
- Insert Shapes and Icons: Use shapes and icons to represent different elements of your information. PowerPoint provides a diverse range of shapes and icons that can be easily customized to suit your needs.
- Add Text Boxes: Integrate text boxes to provide explanations, labels, or additional context. Ensure that the text is concise and complements the visuals.
- Incorporate Images and Charts: Enhance your infographic with relevant images and charts. PowerPoint allows you to insert images and create charts to represent data visually.
- Utilize SmartArt: PowerPoint’s SmartArt feature is particularly useful for creating visually appealing diagrams and processes. Explore the various SmartArt options available to find the one that best fits your content.
- Choose a Color Scheme: Maintain consistency by selecting a cohesive color scheme that aligns with your brand or the topic of your infographic. Harmonious colors contribute to the overall visual appeal.
- Arrange and Align: Pay attention to the arrangement and alignment of elements. Ensure that the layout is clean, and there is a logical flow from one section to another.
What is Timeline Infographic?
A timeline infographic is an excellent way to illustrate chronological events or developments. In PowerPoint, creating a timeline infographic involves:
- Select a Timeline Template: PowerPoint offers specialized timeline templates that you can use as a foundation for your infographic. Choose one that suits the timeline you wish to depict.
- Input Events and Dates: Populate the timeline with key events and their corresponding dates. PowerPoint allows you to easily edit text and adjust the position of timeline markers.
- Customize Design Elements: Personalize the timeline by adjusting design elements such as colors, fonts, and shapes. Tailor it to match the overall aesthetic of your presentation or report.
What is Infographic Poster and how to create that in presentation?
An infographic poster is a large-format visual representation of information designed for display purposes. Creating an infographic poster in PowerPoint involves:
- Set Poster Dimensions: Start by setting the dimensions of your poster. PowerPoint allows you to specify custom dimensions for your slide, ensuring that it meets the requirements of your poster.
- Design Layout: Plan the layout of your poster, considering the placement of text, images, and other elements. A well-organized layout is crucial for visual appeal and readability.
- Insert High-Quality Images: Use high-resolution images to maintain clarity when the poster is printed or displayed. PowerPoint enables you to resize and crop images to fit the poster dimensions.
- Add Captivating Headings: Incorporate clear and captivating headings to guide viewers through different sections of the poster. Use fonts that are easy to read from a distance.
- Print and Share: Once your infographic poster is complete, save it as a high-resolution image or PDF, ready for printing or digital sharing.
Conclusion
In conclusion, PowerPoint, often seen as a presentation tool, can be harnessed to create compelling and informative infographics. Whether you’re aiming to depict a timeline of events or designing an eye-catching infographic poster, PowerPoint provides a user-friendly platform for unleashing your creativity.
By following the steps outlined in this article, you can effectively communicate complex information and engage your audience with visually appealing infographics.


